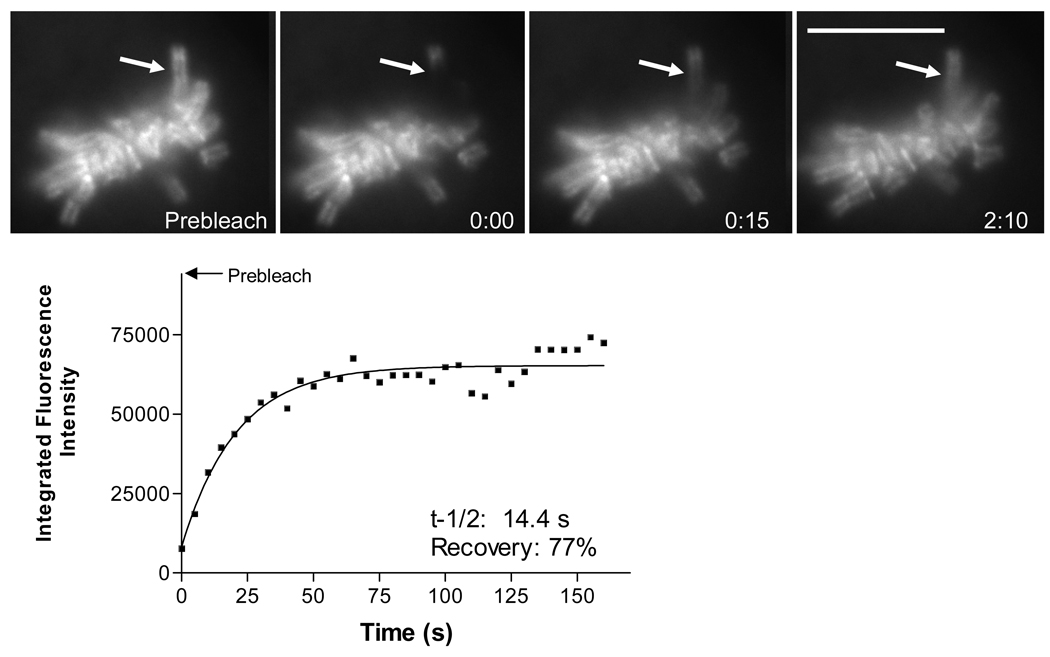
Fig. 5.
Data analysis of photobleaching and recovery of EGFP-TopoIIα in metaphase chromosome arm. Images show a prebleach image and images taken at photobleaching and after for an isolated chromosome arm extending from the metaphase arrayed chromosomes. The graph shows the fitting of corrected intensity measurements in the photobleached region to determine recovery half times (t-1/2) and total degree of recovery (recovery). Bar = 10 µm. (Adapted from 5)

