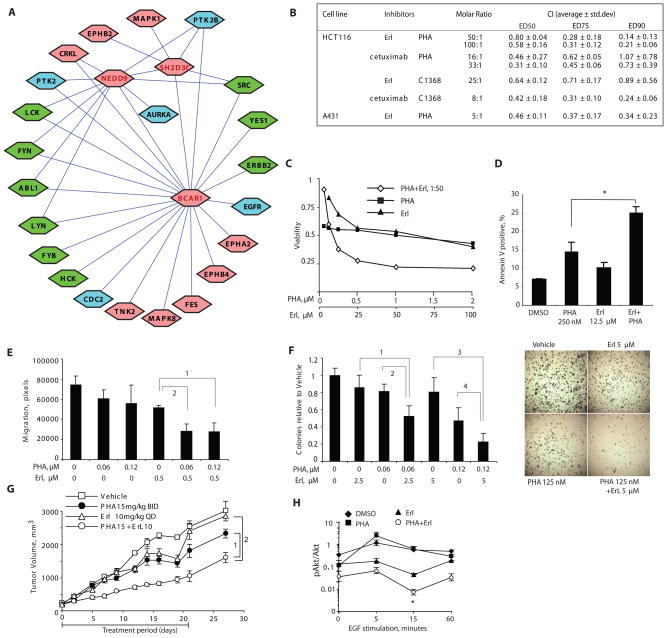
Fig. 6. Synergy between inhibitors of AURKA and inhibitors of EGFR.
(A) Kinases directly associated with the BCAR1-NEDD9-SH2D3C cluster. Kinases for which no clinical small molecule inhibitor is available are indicated in pink; kinases for which small molecule inhibitors are available are indicated in blue or in green, if inhibitor has previously been tested for synergy with EGFR-targeting agents. (B) Inhibitors of EGFR and inhibitors of AURKA synergize to reduce viability of cancer cells in vitro. Summary results of drug interactions calculated as Chou-Talalay combination index (CI) based on Cell Titer blue viability determinations. CI values <1 indicate synergy, and <0.5 strong synergy, between the two agents in producing cytotoxic effect.. (C) Dose-dependent inhibition of HCT116 cell viability by combination of PHA-680632 and erlotinib. (D) Combination of PHA-680632 and erlotinib treatment increases apoptosis in HCT116 cells at 72 hours; *, t-test p=0.001. (E) Cell motility was measured by wound healing assay in cells treated with drugs at concentrations indicated, and assessed over 18 hours. FDR is <10−5 for 1 and 2. (F) Left, relative soft agar colony formation of cells grown for 2 to 3 weeks in drugs at the concentrations indicated. FDR is equal to 1, 0.0003; 2, 0.0006; 3, 0.0003; and 4, 0.004. Right, results from typical experiment. (G) Tumor xenografts were implanted in SCID mice treated with drugs as indicated. The generalized estimating equations approach (with an autoregressive correlation structure) was used to model tumor growth. A linear time-effect was included in the model for the logarithm of tumor volume and interacted with the treatments in each comparison. P-values are 1: 0.005; 2: 0.008. (H) Quantitation of 3 independent Western analyses of protein lysates of cells treated with erlotinib and PHA-680632 for 3 hrs followed by EGF stimulation. Error bars represent standard error of the mean (SEM) of three independent experiments; *, t-test comparing erlotinib to erlotinib + PHA-680632 yielded P = 0.013.

