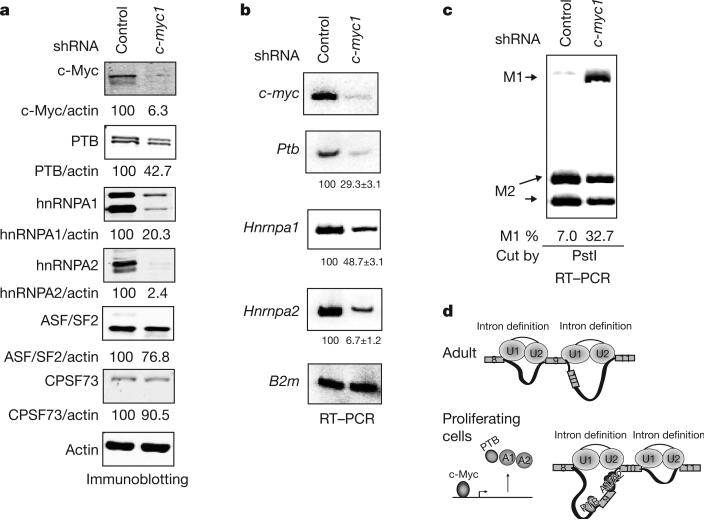
Figure 4. c-Myc upregulates PTB, hnRNPA1 and hnRNPA2 and alters PKM splicing.
a, Immunoblotting using NIH-3T3 cells stably expressing control or c-Myc-targeting shRNAs. Signals were quantified and normalized to actin. b, RT–PCR using the same cell lines as in a, using B2m (β2-μglobulin) as a loading control. Real-time RT–PCR was performed separately to quantify the relative levels of Ptb, Hnrnpa1 and Hnrnpa2 mRNAs in control and c-Myc knockdown cells, using Rpl13a as a reference gene. Relative levels of each are shown below each panel, with s.d. indicated (n = 3). c, Pkm1/Pkm2 ratios in control and c-Myc knockdown cells determined as in Fig. 2a. d, A model for PKM splicing regulation. Top: in adult tissues, low expression of PTB, hnRNPA1 and hnRNPA2 allows for recognition of E9 by the splicing machinery and disrupts intronic structures favourable for E10 inclusion. Bottom: in embryonic and cancer cells, PTB, hnRNPA1 and hnRNPA2 are upregulated, bind to splicing signals flanking E9 and repress its inclusion. Binding of these proteins around E9 and possibly to other sites creates an intronic structure favourable to E10 inclusion.

