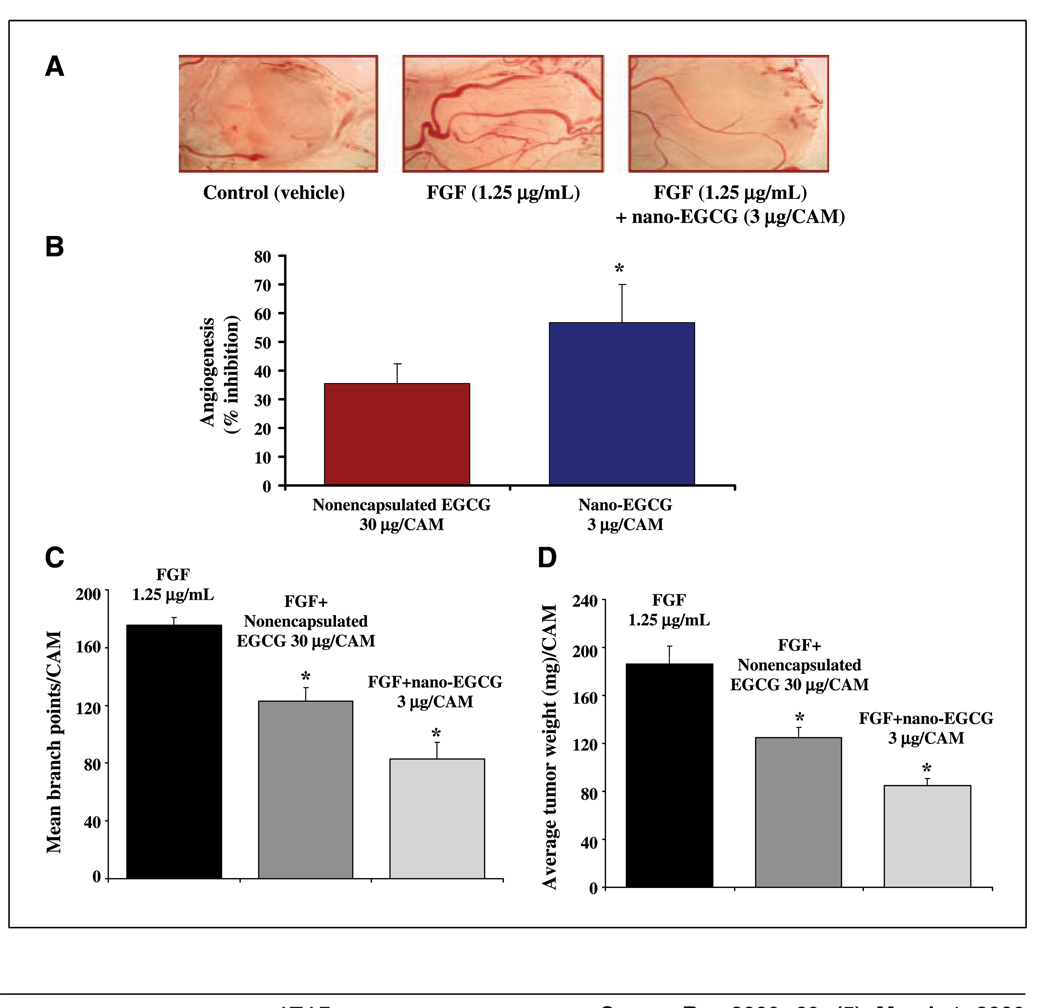
Figure 3.
Comparative effects of nano-EGCG and nonencapsulated EGCG on FGF-induced angiogenesis. A, CAM assay. Photopictographs of a typical experiment showing the angiogenesis pattern in different treatments. Data are from a typical experiment repeated in five CAM with similar results. B, bar graph showing percentage inhibition of angiogenesis in nonencapsulated EGCG–treated and nano-EGCG–treated CAM. Columns, data of angiogenesis from experiment done with five CAM membranes with similar results; bars, SE. *, P < 0.05 compared with the EGCG-treated group. C, mean branch points. Mean branch points were counted per CAM. Columns, data for inhibition of mean branch points in CAM membranes from a typical experiment repeated in five CAM with similar results; bars, ±SE. *, P < 0.05 compared with the vehicle-treated controls. D, average tumor weight. CAM tumors were excised and weighed 5 d after cell grafting. Data are from a typical experiment repeated in five CAM with comparative results. *, P < 0.05 compared with the vehicle-treated controls.

