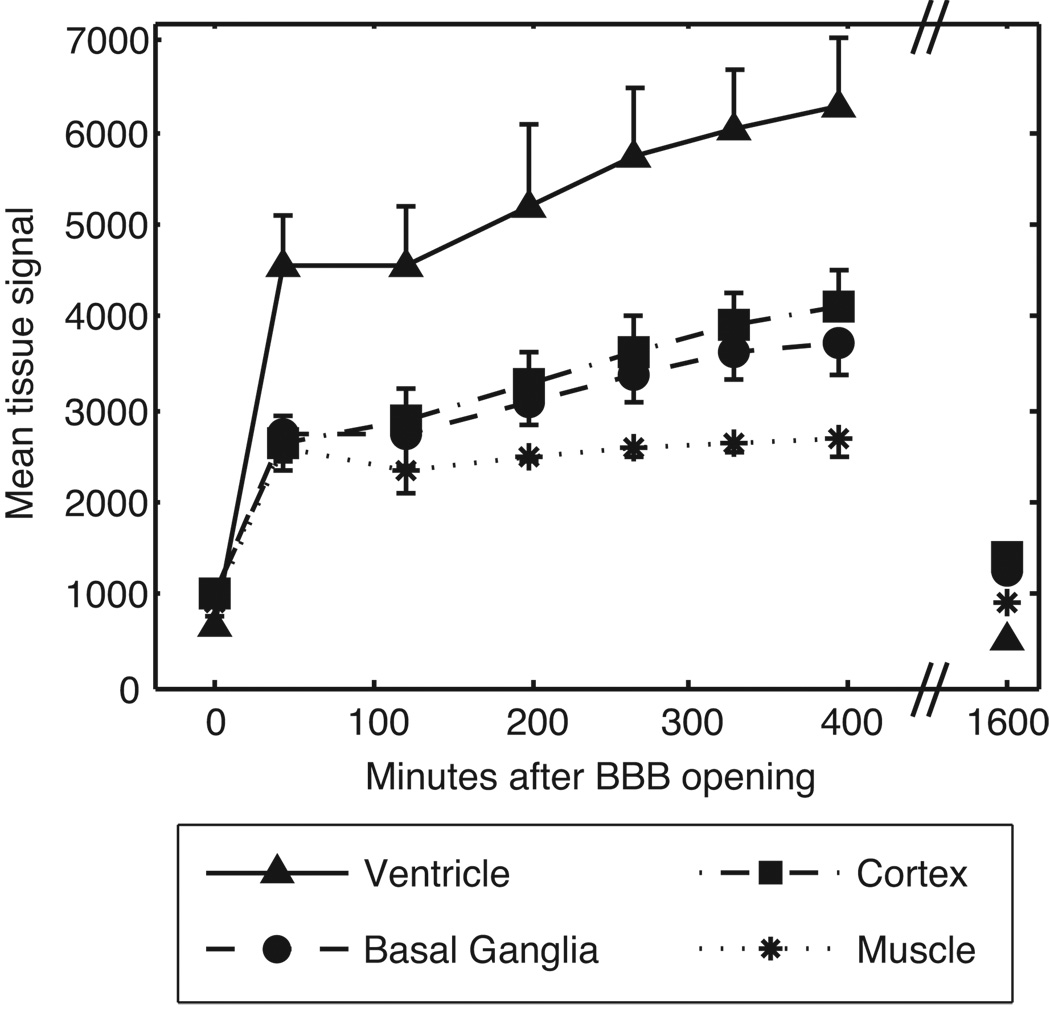
FIG. 4.
Time course of Gd-DTPA enhancement in the brain and muscle after BOMUS. T1-weighted images (high-throughput protocol) were acquired prior to Gd-DTPA and BOMUS (plotted at time 0), serially after BOMUS, and 27 hours after BOMUS. ROIs were placed in the jaw muscle, lateral ventricle, cerebral cortex, and basal ganglia to measure the mean signal intensity. Plot shows mean ± standard deviation (n = 6 except at 27 hours for which n = 1).

