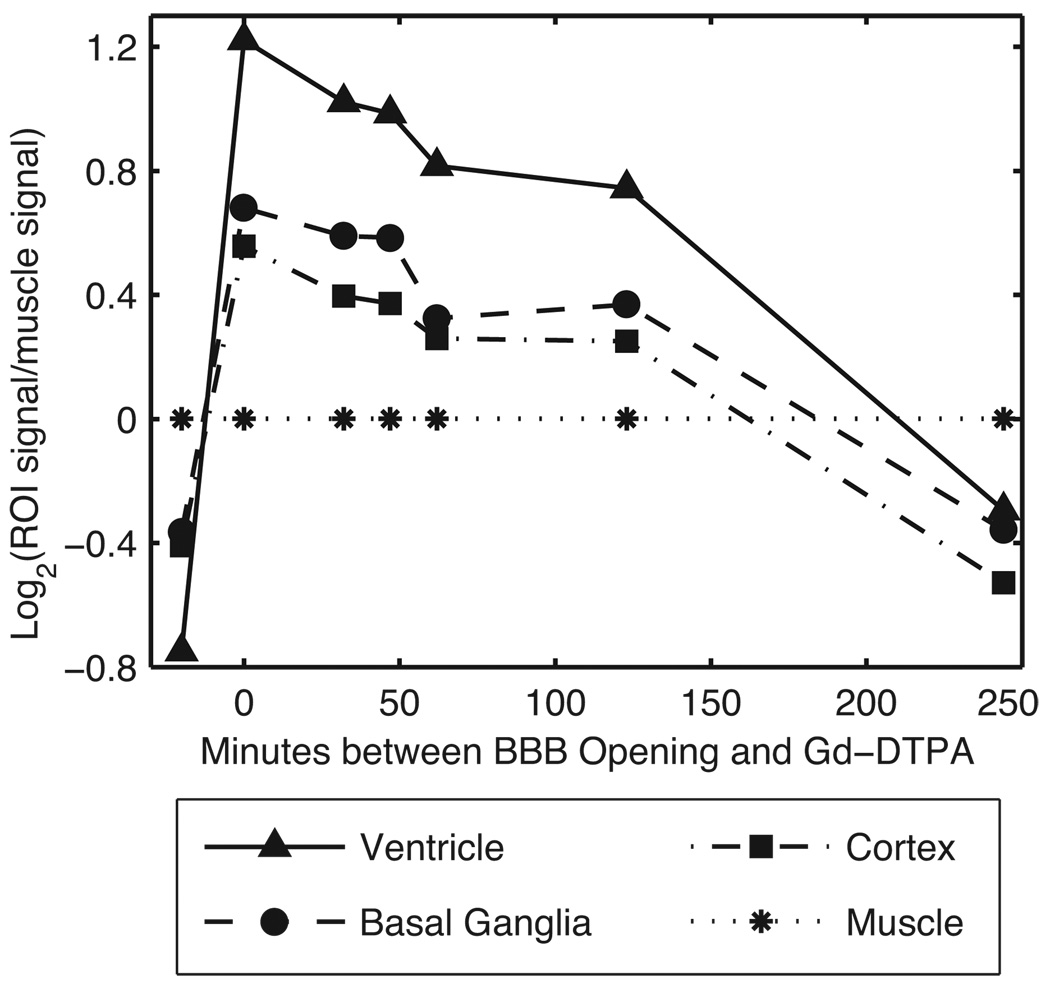
FIG. 5.
The duration of BBB disruption was demonstrated by assaying BBB permeability at several times after BOMUS. A separate animal was used to assay each time point. Signal measurements were made in several ROIs from T1-weighted images (high-throughput protocol). To account for inter-animal variability, the muscle signal was used to normalize the intracranial signals: log2 (tissue signal/muscle signal) is plotted along the y-axis. For comparison, data from an untreated control animal is shown at time < 0.

