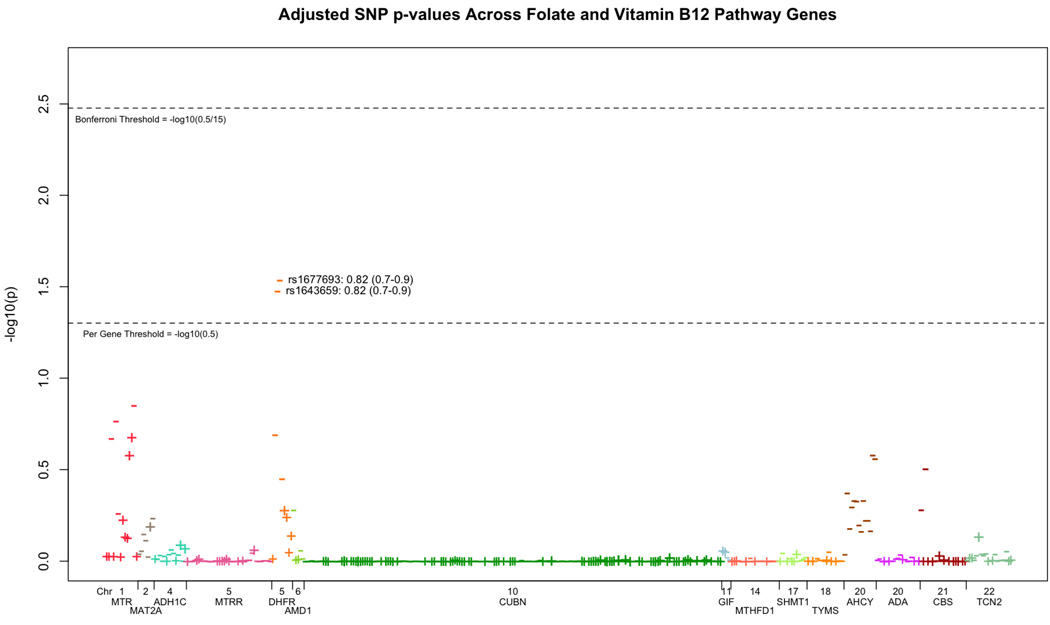
Figure 1.
Single SNP analysis of the total study population. Odds ratios were estimated assuming a log additive model for all SNPs. Each gene is a different color. The + symbol means the per minor allele OR was greater than 1.0 and the – symbol means the OR was less than 1.0. P-values were corrected for multiple comparisons by the method of Connelly and Boehnke (18). We show a Bonferroni adjustment to account for the inclusion of 15 genes in the analysis.

