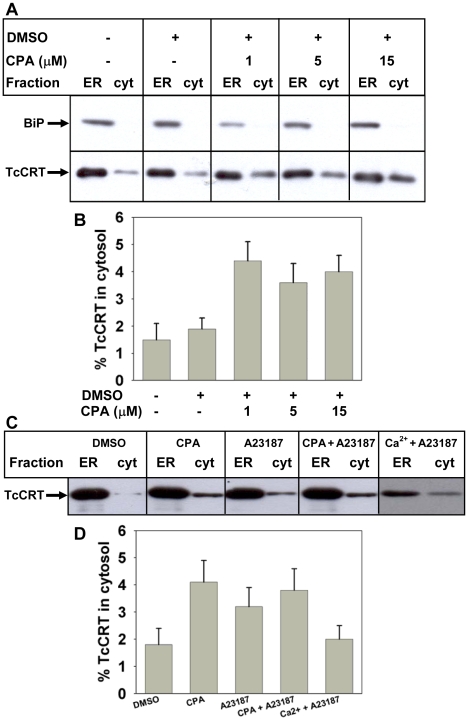
Figure 1. ER calcium mobilization induces TcCRT retrotranslocation.
(A) Cellular distribution of TcCRT (lower gel) and BiP (upper gel) with no treatment or with the addition of DMSO and CPA as indicated. (B) Relative amount of cytosolic TcCRT with respect of total TcCRT of bands shown in (A). (C) Effect of the calcium ionophore A23187, CPA and/or external added calcium on the cellular distribution of TcCRT. (D) Quantification of the amount of cytosolic TcCRT with respect of total TcCRT of bands shown in (C). In B and C bars represent the standard error of triplicate measurements. In all cases the ER containing fractions were diluted ten fold.

