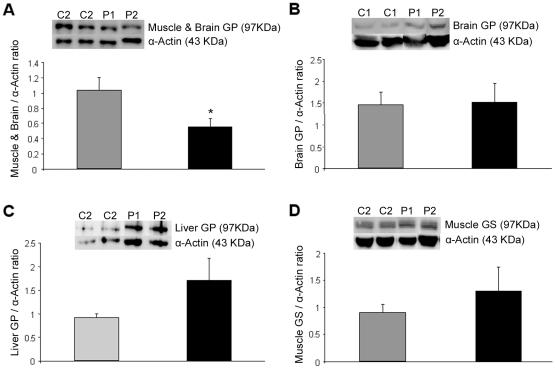
Figure 6. Immunoblotting analysis for brain/muscle GP, brain GP, liver GP and muscle GS proteins, of 7 days differentiated cell lines.
Grey bars represent controls (C1, C2) and black bars patients (P1, P2). Anti-actin immunoblotting was performed as loading control. Representative images of brain/muscle GP (A), brain GP (B), liver GP (C) and muscle GS (D) are shown. Ratios of intensity of GP (A, B and C) and GS (D) bands compared to intensity of α-actin bands are shown as mean ± SEM. The significance of the difference versus controls is *p<0.05.

