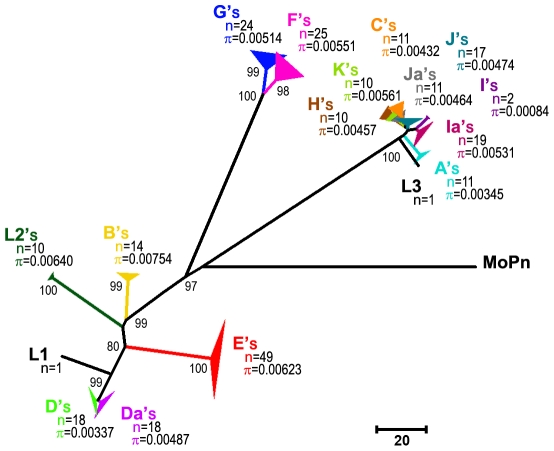
Figure 1. ompA phylogeny of the 251 C. trachomatis genetic variants.
The represented tree was generated using the Neighbour-Joining method (with Kimura 2-Parameter model) but similar topologies were obtained with other methodologies (see Methods). Genotypes are represented in different colors. Thickness of solid triangles is proportional to the number of taxa from each genotype (n). The mean genetic diversity within each ompA genotype-population (π) is shown. The ompA sequence from C. muridarum strain MoPn (NC002620) was used to root the tree. Bootstrap values (1,000 replicates) are shown next to the branch nodes.

