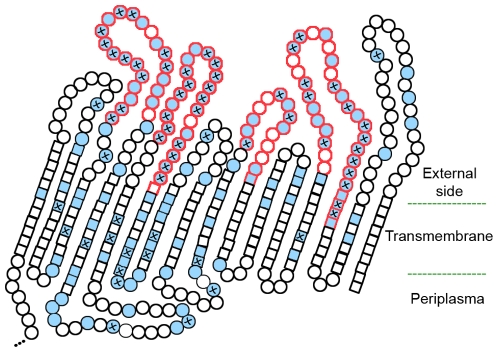
Figure 3. Topology sketch of MOMP mutational hotspots.
VDs are presented in red, while CDs are in black. Circles represent amino acids located at external loops and periplasmic turns, while squares represent amino acids of the transmembrane β-strands (based on refs [12], [35]). Sites of the protein that were already subject to amino acid alterations are fulfilled in blue. Protein sites that were simultaneously mutated among strains from two to ten different genotypes (mutational ‘hotspots’) are marked with a cross.

