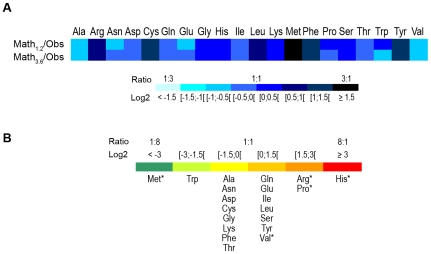
Figure 5. Evolutionary dynamics of amino acid gains and losses.
(A) Ratio between the amino acid ‘expected’ frequency (calculated by mathematical modeling using two different overall mean R values, 1.2 (upper row) and 3.6 (lower row) – see methods) and the ‘observed’ frequency for the 251 genetic variants. Normalized ratio intervals (log2) are color-coded. For Trp, which was the unique amino acid that was never created from the total 511 variable sites found in ompA, the ‘observed’ frequency was calculated by determining the mid-point of the respective exact 95% confidence interval using the ration between the F and Binomial distribution [57]. (B) Empirical data showing the ratio of created/removed amino acid substitutions that were ‘observed’ among the 251 genetic variants. Normalized ratio intervals (log2) are color-coded, and each amino acid is shown below to the correspondent interval. Statistical significance (P≤0.02) was found for the amino acids marked with an asterisk. For panels (A) and (B), logarithmic transformation of the ratios is required for symmetrical distribution of the data around zero.

