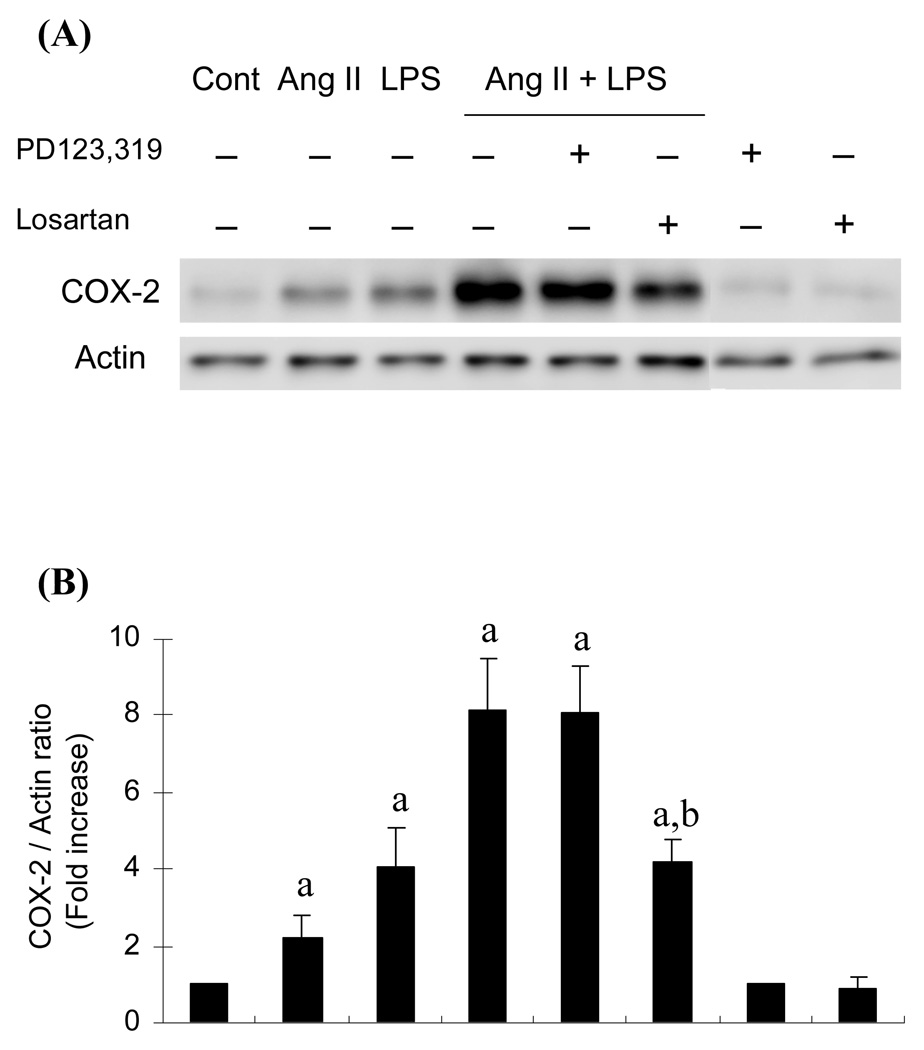
Fig. 4.
Effect of Ang II and LPS on COX-2 protein expression in RIE-1 cells. Cells were treated with either Ang II (10−8 M), LPS (5 µg/ml) or both for 6 h in the presence or absence of AT1-specific antagonist losartan (10−6M) or AT2-specific antagonist PD123319 (10−6 M). Western blot analysis of the COX-2 protein was carried out as described in the Materials and Methods section. Quantification of COX-2 protein in panel B was carried out by scanning densitometry and averages of the three expression levels normalized by actin levels are displayed in the histogram. a, P≤0.05 as compared to the level in the untreated control. b, P≤0.05 as compared to the level in Ang II and LPS treated cells.

