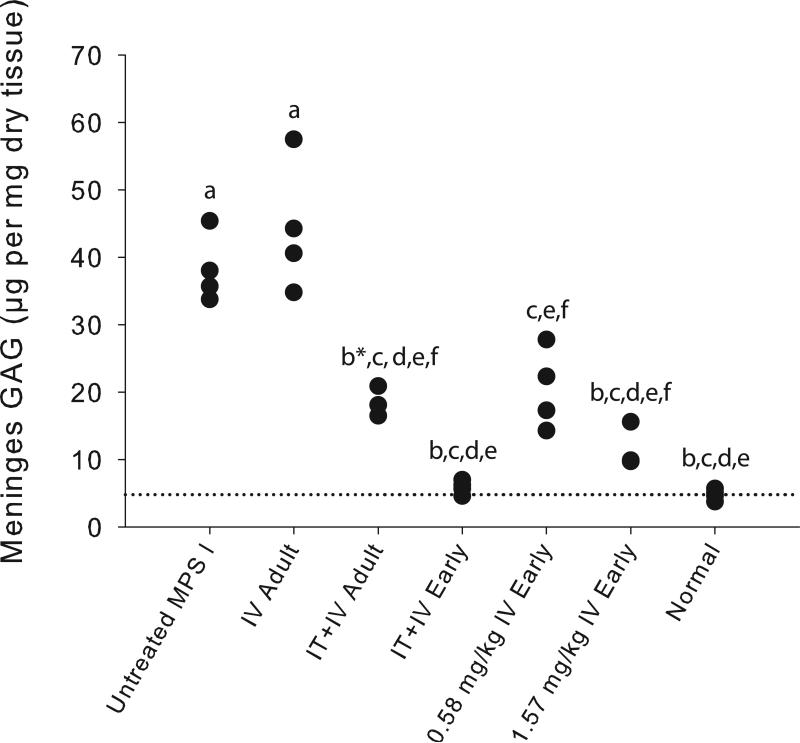
Fig. 3.
Glycosaminoglycan storage in spinal meninges. Quantitative GAG levels in pooled samples from cervical, thoracic, and lumbar meninges in the experimental groups. Each animal is represented on the graph. Untreated MPS I dogs were aged-matched to the early-treatment groups at necropsy. The dotted line indicates the mean of normal animals (4.78 ± 0.818 units/mg). Tukey-Kramer post-hoc analysis yielded results that showed multiple inter group differences. Groups that were similar by statistical analysis are indicated by common letters above each group. Groups with different letter superscripts were significantly different (p<0.01). One comparison (IT+IV Adult versus Normal) was nearly significant at p=0.032.

