
Figure 3. Ingenuity Pathways Analysis (IPA) and Affymetrix GeneChip® Mouse Genome 430 2.0 Array (Affymetrix a) annotation status for 113 PIDs over four annotation releases.
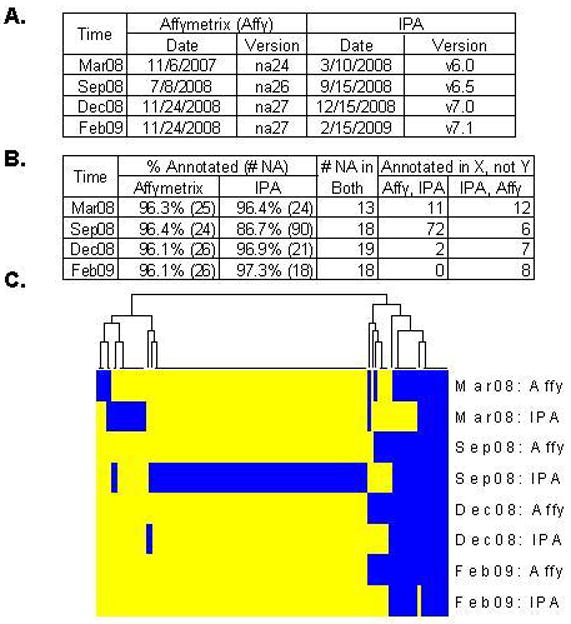
A. IPA release and Affymetrix annotation information. B. Numbers of annotated PIDs among 678 PIDs of interest were compared between Affymetrix and IPA over four IPA releases. Affymetrix consistently annotated 96.1–96.4% of PIDs while IPA varied from 86.7–97.3%, with 90 PIDs that were not annotated by IPA in September 2008. C. Heatmap view of a 113 PID subset (of the 678 set) that lacked a gene symbol annotation at least once from either Affymetrix or IPA over the four time points. Annotated PIDs are indicated in yellow and unannotated in blue. September 2008 (IPA v6.5) had an unusually high percentage of missing annotations in comparison to other versions (v6.0, v7.0, v7.1).