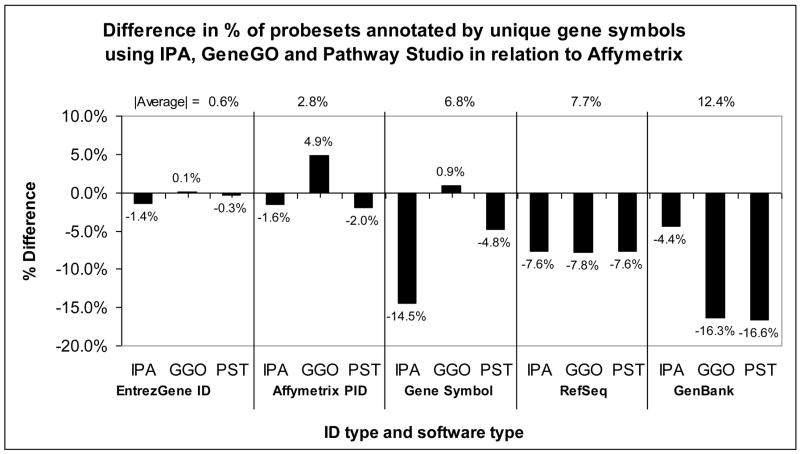
Figure 4. Percent of PIDs annotated with unique gene symbol out of 45037 PIDs, by IPA, GeneGO (GGO) and Pathway Studio (PST) in relation to the % annotated by Affymetrix.
This graph represents the “% Exported out of 45037 vs. Affy” data in Table 1. Results are sorted by ID type. The percentage of Entrez Gene IDs that were annotated with gene symbol are in close agreement with Affymetrix for all PAS. GGO and PST have more similar annotation percentages than IPA. The naming convention for the x-axis is [Gene ID.PAS]. Average magnitudes are calculated for ID types.

