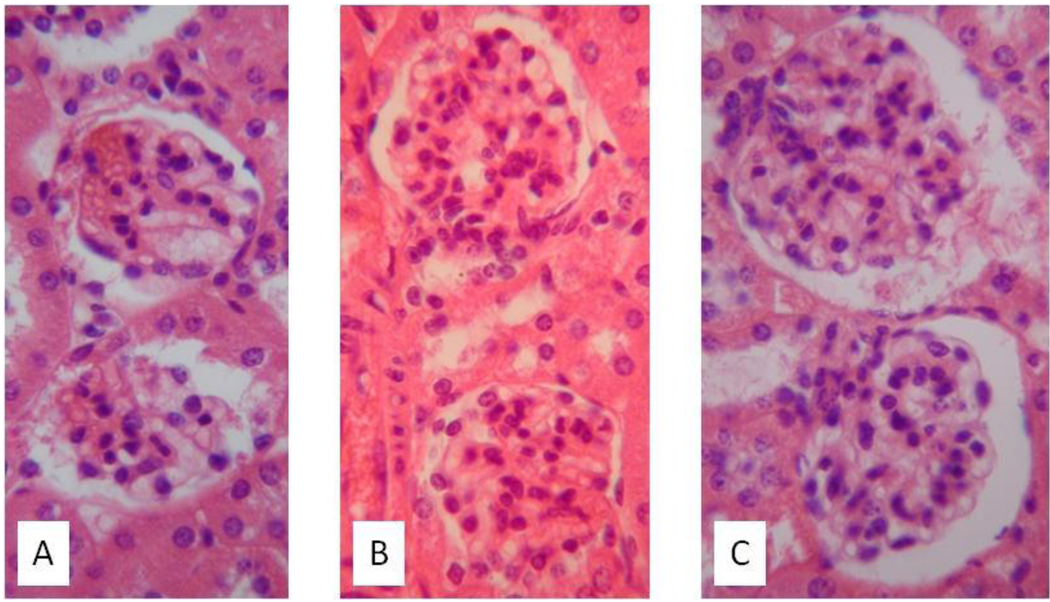
Figure 3.
Histological findings in recipients of T cell vaccination and mock treatment. At the conclusion of the study protocol, mice were sacrificed and haematoxylin and eosin (H&E) stained renal images were prepared as in Figure 1. Representative images are shown. A: T cell vaccine recipient with normalization of urinalysis (“responder”) shows normal renal histology. B: T cell vaccine recipient with persistently active urinary sediment (“nonresponder”) shows proliferative glomerulonephritis. C: Mock vaccine recipient with persistent active urinary sediment shows proliferative glomerulonephritis.

