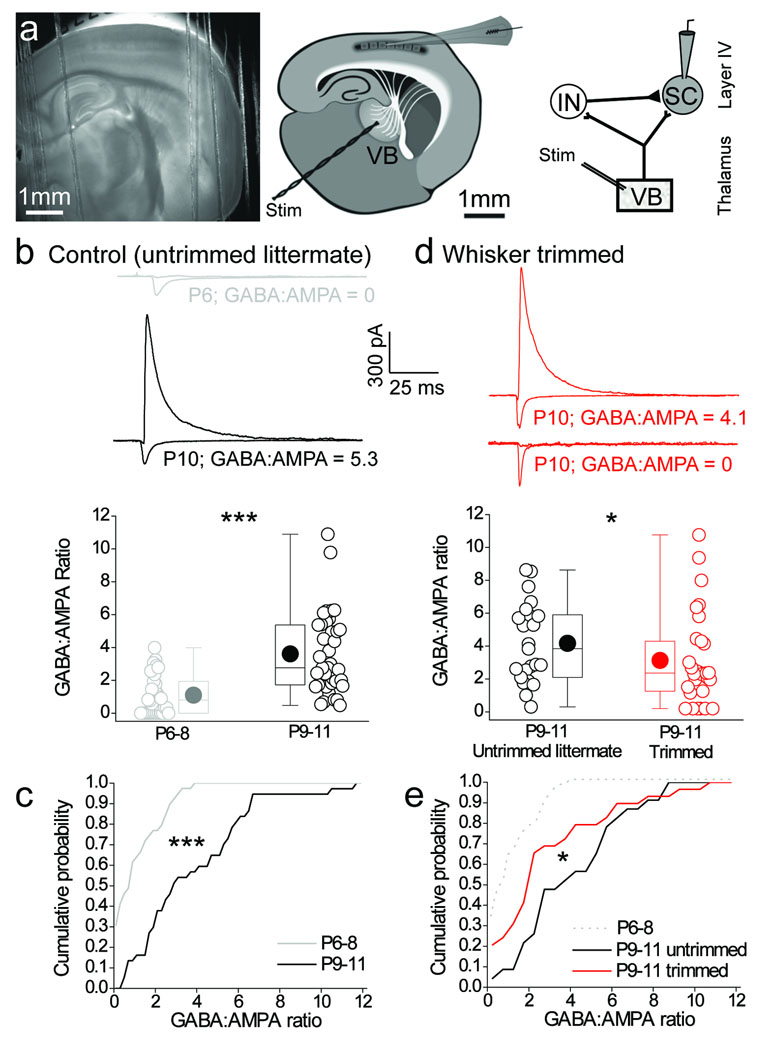
Figure 1. Sensory experience drives the developmental increase in feed–forward inhibitory input in layer 4 barrel cortex.
(a) 4 × low–magnification DIC image of the thalamocortical slice, (left panel); schematic of the thalamocortical slice indicating placement of the bipolar stimulation electrode in the ventrobasal thalamus (VB) and site of whole–cell recording in layer 4 barrel field (center panel); Schematic of recording configuration depicting stimulation in VB to elicit a monosynaptic excitatory input and disynaptic feed–forward inhibition from the interneuron (IN) to the layer 4 stellate cell (SC; right panel). (b,c) Box–and–whisker/scatter plots (see methods for description) Eroorand cumulative frequency distributions of the amount of feed–forward inhibition calculated as the GABAA:AMPA peak amplitude ratio (GABA:AMPA ratio; see methods for details) during postnatal development for all individual stellate cells recorded and binned for P6–P8 and P9–11 age groups. The voltage clamp traces are from a stellate cell that displayed no feed–forward input at P6 (GABA:AMPA ratio = 0; gray traces) and one with a relatively large GABA:AMPA ratio at P10 (black traces). (d,e) Box–and–whisker/scatter plots and cumulative frequency distributions of the GABA:AMPA ratio for all individual stellate cells recorded at P9–11 in whisker–trimmed and untrimmed littermates. Voltage clamp traces are from a stellate cell that displayed a large (GABA:AMPA ratio = 4.1; upper red traces) and no (GABA:AMPA ratio = 0; lower red traces) feed–forward input in P9–11 whisker–trimmed animal. For comparison, the gray dotted line is re–plotted from the P6–8 data in c. n = 23–39. Two tailed Mann–Whitney U–test used for data in b,d and Kolmogorov–Smirnov test used for data in c,e; *p < 0.05, ***p < 0.001.

