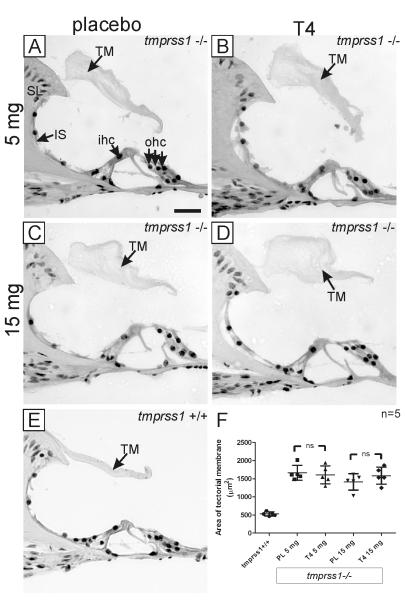
Fig. 2.
Prenatal T4 treatment in tmprss1−/− mice and cochlear morphology. Representative cochlear images of tmprss1−/− mice receiving 5 mg placebo (A), 5 mg T4 (B), 15 mg placebo (C), 15 mg T4 (D), and a tmprss1+/+ mouse (E). Scale bar: 20 μm. A graph displaying data point of each area measurement of the tectorial membrane per group, including means and standard deviations, is shown in (F). Abbreviation: ns, not significant.

