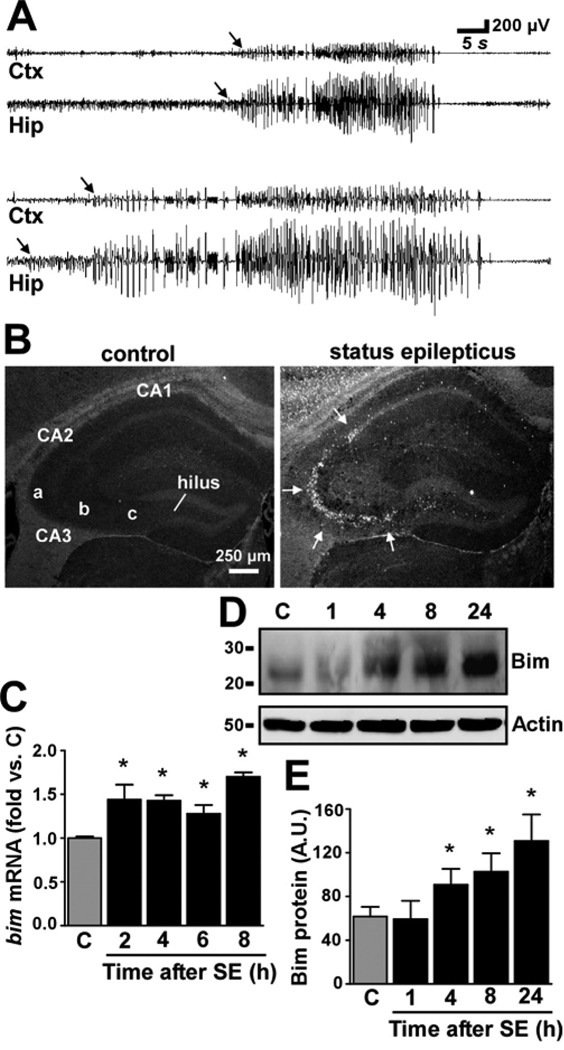
Figure 1. Upregulation of Bim in the hippocampus during seizure-induced neuronal death.
(A) Traces of two high amplitude high frequency seizure burst events captured using combined intra-hippocampal-cortical EEG. Arrows demark point of onset. Note that seizure activity is detected in the hippocampus (Hip) before the cortex (Ctx). (B) Photomicrographs (4× lens) show representative Fluoro-Jade B staining at 24 h in hippocampus of control mice and mice that underwent status epilepticus. Arrows denote cells (white) undergoing degeneration. (C) Graph showing quantification of mRNA levels for bim corrected to β-actin in control (C, 2 h) and seizure-damaged mice at various time points after lorazepam was given. Data are from four independent experiments. (D) Representative Western blot (n = 2 per lane) showing increased expression of Bim from 4–24 h after seizures compared to control and 1 h post-seizure. Actin is shown as a control for protein loading. (E) Graph showing semi-quantification of Bim protein levels. Data are from three independent experiments. A.U., arbitrary units. Molecular weight markers are depicted to the left. *p < 0.05 compared to control.

