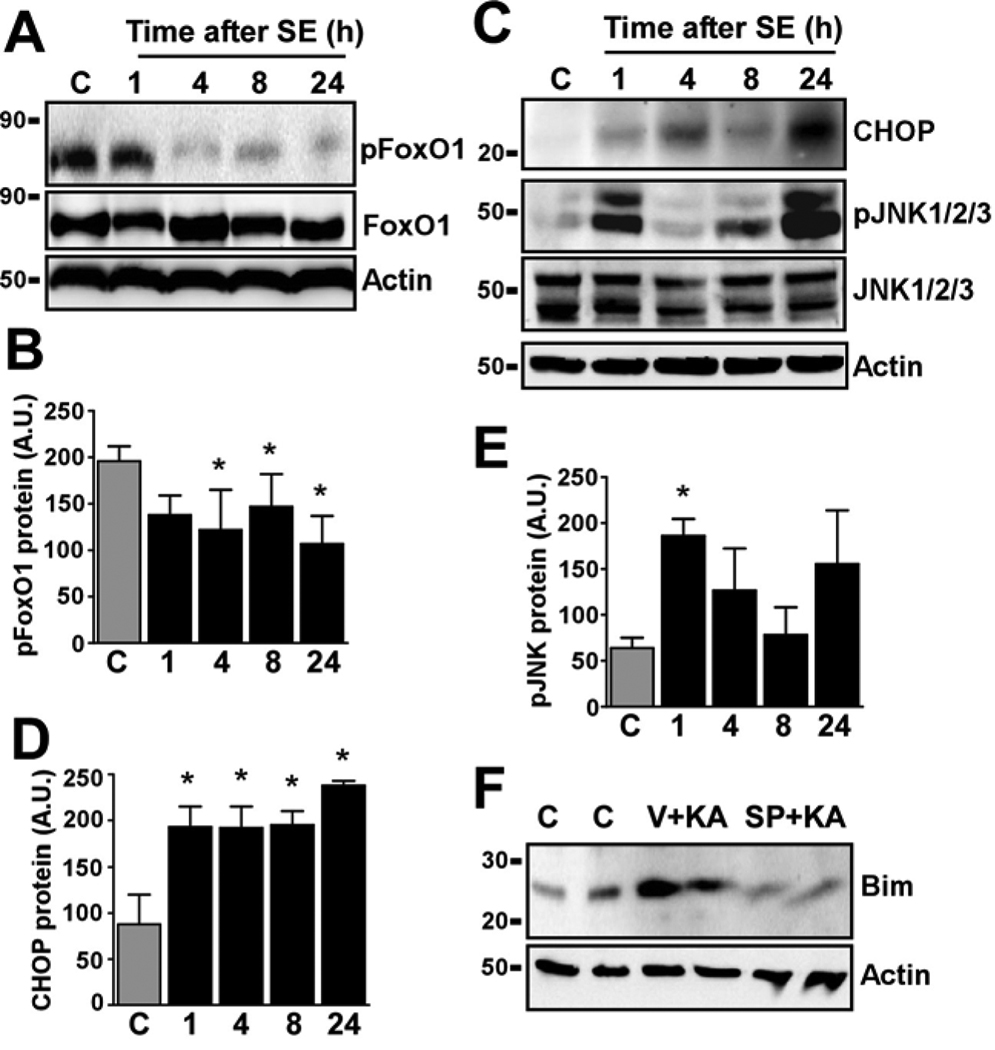
Figure 2. Activation of transcription factors linked to Bim regulation in the hippocampus after status epilepticus.
(A) Representative Western blots (n = 2 per lane) showing expression of phosphorylated (p)FoxO1 declined following seizures. Blot below shows the non-phosphorylated form and Actin as a protein loading control. (B) Graph showing semi-quantitative analysis of pFoxO1 levels in the hippocampus. (C) Representative Western blots (n = 2 per lane) showing expression of CHOP and JNK1/2/3 isoforms. Note increased CHOP and pJNK levels. (D) Graph showing semi-quantitative analysis of CHOP levels in the hippocampus. (E) Graph showing semi-quantitative analysis of pJNK1/2/3. Data are from three independent experiments. *p < 0.05 compared to control (C, 4 h). (F) Representative Western blots (n = 1 per lane) showing hippocampal Bim expression at 24 h in control and KA-treated mice given either vehicle (V) or the JNK inhibitor SP600125 (SP). Note reduced Bim induction in seizure mice treated with SP600125. Actin is included as a protein loading control.

