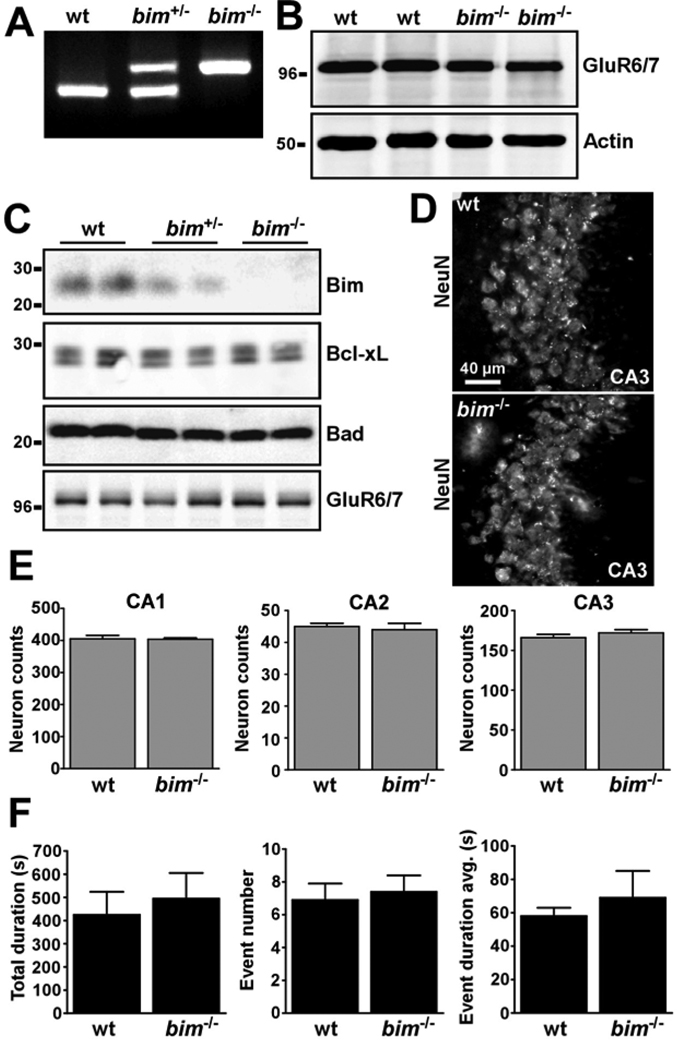
Figure 4. Genotype and phenotype analysis of bim−/− mice.
(A) Representative PCR showing genotyping of mice. (B) Representative Western blot (n = 2 per lane) confirming normal expression of KA receptor GluR6/7 in the mouse amygdala between wild-type (wt) and bim knockout mice. Actin is shown as a control for protein loading. (C) Representative Western blots of hippocampal samples confirming Bim deficiency in bim−/− mice, while levels of a selection of other proteins are normal. (D) Representative photomicrographs of NeuN-stained CA3 subfields from wild-type and bim−/− mice. (E) Graphs showing counts of NeuN-positive cells in various hippocampal fields. No differences were evident between mice of the two genotypes (n = 3 per group). (F) Graphs showing EEG data on seizure parameters between wild-type and bim−/− mice following intra-amygdala KA microinjection. No differences were found between mice of the two genotypes (n = 9–10 per group).

