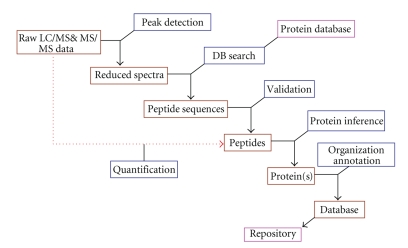
Figure 5.
Schematic representation of the different modules constituting a data analysis pipeline. RT: retention time; z: charge state; Int: signal intensity; Seq: peptide amino acid sequence; Prot: protein accession number and sequence; DB: database; Std: standard; MM: molecular mass. Adapted from: Bruno Domon and Ruedi Aebersold, Molecular & Cellular Proteomics 5:1921–1926, 2006.

