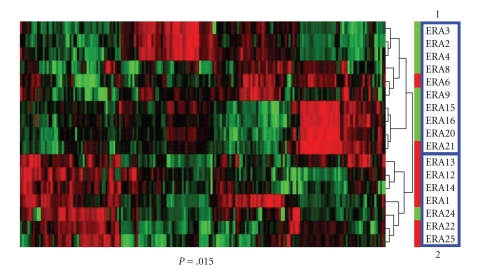
Figure 1.
Unsupervised hierarchical clustering was applied to the expression profile of 192 genes using the filtering condition (SD = 2). Patients segregated into two clusters: 1 and 2. Difference of distribution of severe or mild patients in the two clusters was significant, P = .015, Fisher's Exact Test.

