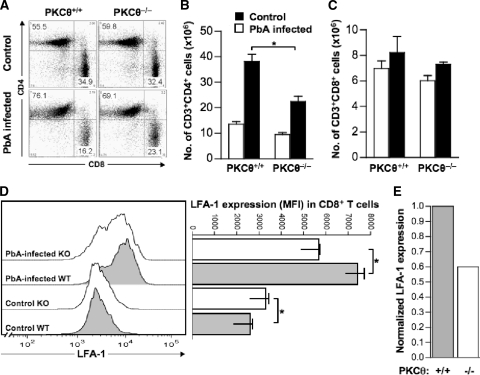
FIG. 9.
Quantitation of CD4+ and CD8+ splenic T cells, and surface expression of LFA-1 on CD8+ T cells from control and PbA-infected PKCθ+/+ and PKCθ−/− mice. Spleens were removed from control and PbA-infected PKCθ+/+ and PKCθ−/− mice on day 12 p.i. Cells were counted and stained with Pacific Blue-conjugated anti-CD4, PE-conjugated anti-CD8, and FITC-conjugated anti-LFA-1 antibodies, followed by FACS analysis. The data represent the proportions (A) and total numbers of CD3+ CD4+ (B) and CD3+ CD8+ (C) T cells per spleen. A dot plot representing one of four independent experiments is shown in panel A. The bar graphs (B and C) demonstrate average values of cell numbers obtained by analyses of spleens from four individual mice per group. Representative histograms show LFA-1 expression on splenic CD3+CD8+ T cells from uninfected and PbA-infected PKCθ+/+ and PKCθ−/− mice (D, left panel), and values in the bar graph show the MFI values of the cells obtained from analyses of spleens from four individual mice per group (D, right panel). PbA infection-induced increase in LFA-1 expression on the surfaces of CD3+ CD8+ T cells is shown in panel E. Values represent averages of the MFI in cells from infected mice (n = 4) divided by the MFI of LFA-1 in cells from control, uninfected mice (n = 4). The data are means ± the SEM of four individual mice per group, representing one of two individual experiments. *, P < 0.05 (PKCθ+/+ versus PKCθ−/−) as determined by Student t test. Gray and white bars in panels E and F represent data from PKCθ+/+ and PKCθ−/− cells, respectively.

