FIG. 3.
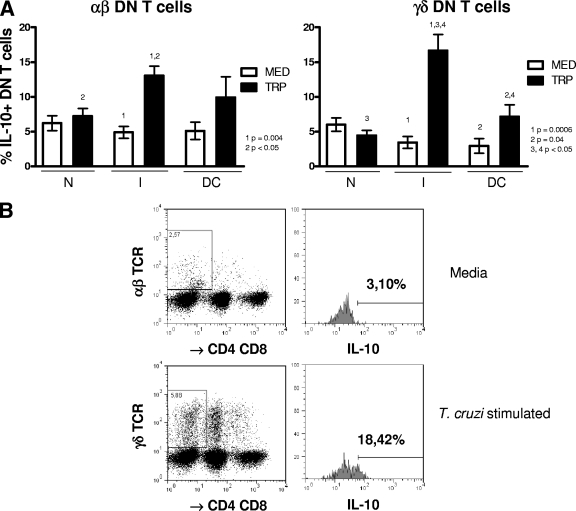
γδ DN (CD4− CD8−) T cells from indeterminate chagasic patients display a biased down-modulatory profile following stimulation with T. cruzi. Whole blood cells from noninfected controls (N), indeterminate chagasic patients (I), and dilated cardiac chagasic patients (DC) were incubated overnight with either medium alone (MED) or with live T. cruzi (TRP) and then analyzed using flow cytometry for the frequency of αβ or γδ DN T cells producing IL-10, as described in Materials and Methods. The data represent the average for each group ± standard deviations. The numbers of individuals in each group were as follows: N, seven; I, seven; and DC, five. Panel A shows the average percentage of IL-10-producing cells within the αβ or γδ DN T-cell population from individual cultures without (MED) or with (TRP) stimulus for each group. Statistical significance is indicated in each graph, with differences between groups indicated by common numbers. Comparisons between groups were performed using Tukey-Kramer comparison of all pairs, and comparisons within groups (MED versus TRP) were performed using a paired t test, as described in Materials and Methods. Panel B shows representative dot plots and gating for analysis of αβ and γδ CD4− CD8− T cells producing IL-10. Both anti-CD4 and anti-CD8 antibodies were conjugated with CyChrome, allowing identification of the DN T cells using specific antibodies against both αβ and γδ T-cell receptors conjugated with FITC. The gates used for determining the percentage of DN T cells producing IL-10 were then determined in a histogram using anti-IL-10 conjugated with PE. The percentages of cells producing IL-10 from cultures either with medium alone or with T. cruzi stimulation were determined, as described in Materials and Methods. All patients were meticulously classified based on clinical criteria, as described in Materials and Methods.

