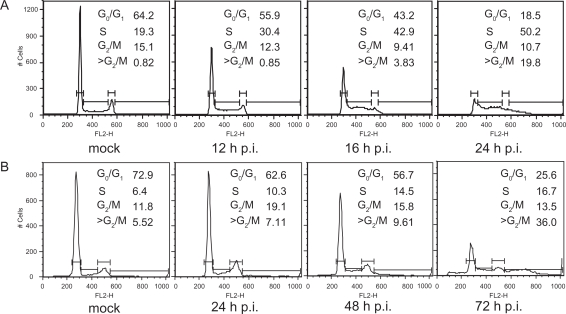
Figure 2.
Induction of cell cycle arrest. Flow cytometric analysis showing the DNA histograms of PI-stained mock- and CPV-infected NLFK and A72 cells at indicated time points post infection. Percentage of cell population in each cell cycle phase is given. (a) Mock- (24 hours post infection) and CPV-infected (12 hours, 16 hours, and 24 hours post infection) NLFK cells. (b) Mock- (72 hours post infection) and CPV-infected (24 hours, 48 hours, and 72 hours post infection) A72 cells.

