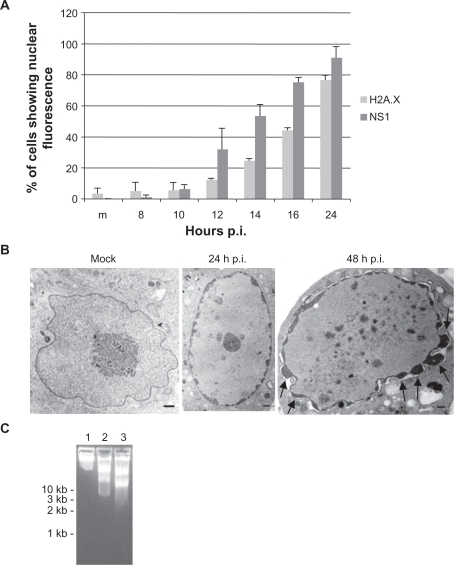
Figure 5.
Biochemical and molecular changes in CPV-infected NLFK cells. (a) Phosphorylation of histone H2A.X. CPV-infected cells were fixed at different time points post infection and labeled with anti-phospho-histone H2A.X and anti-NS1 antibodies (a marker of virus protein expression). Percentage of H2A.X and NS1 positive cells were calculated (n = 1,000). m = mock-infected cells 24 hours post infection. Error bars indicate standard deviations. (b) and (c) Condensation and fragmentation of the nucleus and DNA during infection. (b) Transmission electron microscopy pictures of mock-infected (48 hours post-infection) and CPV-infected nucleus at 24 hours postinfection and 48 hours post-infection. Bars 1 μm. Arrows show nuclear membrane blebbing. (c) Agarose gel electrophoresis showing fragmentation of DNA in infected cells. Lane 1: mock-infected cells 48 hours post-infection, Lane 2: 24 hours post-infection, Lane 3: 48 hours post-infection.

