Figure 4.
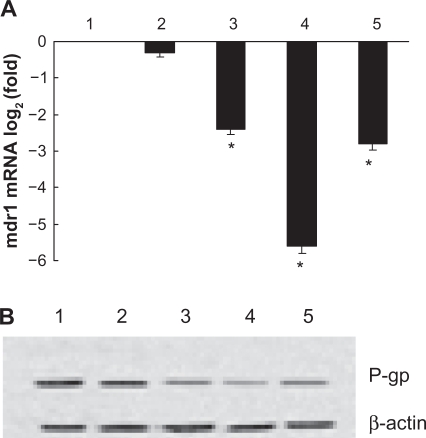
Effects of shRNA expression vectors on MDR1 mRNA and its protein in K562/A02 cells after treatment for 48 hours. A) Transcription of MDR1 mRNA detected by quantitative real-time PCR described before; B) Expression of P-gp determined by Western-blot analysis described before.
Notes: 1. Negative control (PGC silencer-U6-neo-GFP empty plasmid); 2. Positive control (PGC silencer-U6-neo-GFP GAPDH plasmid); 3. PGY1–1; 4. PGY1–2; 5. PGY1–3. *P < 0.05, when compared to positive control group; P < 0.05, the group of transfected cells with PGY1–2 was less than that of transfected cells with PGY1–1 or PGY1–3.

