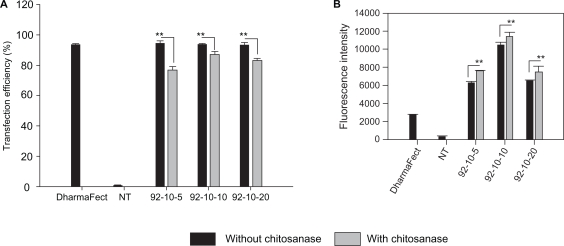
Figure 1.
FACS analysis of chitosan/DPP-IVODN polyplexes uptake in HepG2 cell line. Uptake of 5′-6FAM labeled DPP-IVODN in chitosanase treated and untreated cells 24 hours post transfection. (A) Transfection efficiency was calculated as the percentage of 5′FAM-DPP-IVODN labelled cells. (B) The relative amount of internalized DPP-IVODN was determined using flow cytometry and is expressed as the median of fluorescence intensity (FI) of the 6FAM-DPP-IVODN positive cells. Data points represent the mean values ± SD, n = 3.*P < 0.05; **P < 0.01.

