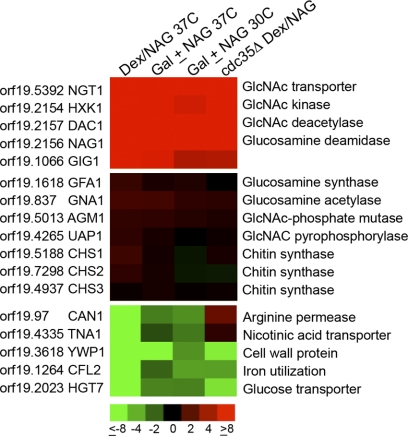
Fig. 1.
Microarray analysis of GlcNAc-regulated genes. The effects of GlcNAc on gene expression were analyzed in four different types of microarray experiments, each carried out in duplicate. (Top) The genes induced most consistently and to the highest levels; (center) genes encoding proteins that synthesize GlcNAc and chitin synthase genes, which show essentially no change in expression; (bottom) the most highly repressed genes. The color code for the fold change in gene expression is given at the bottom (red, induced; green, repressed). Columns show results for cells of the wild-type strain DIC185 grown in dextrose or switched to GlcNAc for 2 h at 37°C (Dex/Nag 37C), strain DIC185 cells grown at 37°C in 2% galactose alone or with the addition of 5 mM GlcNAc for 2 h (Gal ± NAG 37C), cells grown in galactose with or without GlcNAc at 30°C (Gal ± NAG 30C), and a cdc35Δ strain that lacks adenylyl cyclase grown in dextrose or switched to GlcNAc for 2 h (cdc35Δ Dex/NAG).

