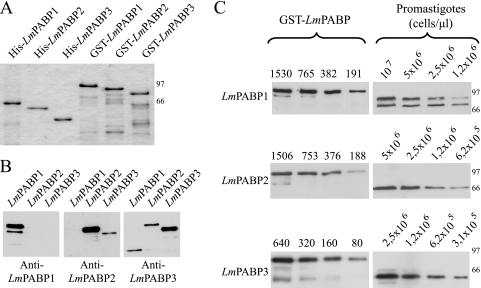
Fig. 2.
Quantitation of intracellular levels of LmPABP1, -2, and -3. (A) His- and GST-tagged recombinant versions of the three L. major PABP homologues used in this work. The sizes of molecular mass markers (kDa) run on the same gel are shown on the right. (B) Specificities of the antibodies produced against the PABP homologues. The three GST fusions were blotted with three different antisera (indicated below each blot). (Left) Eight nanograms of LmPABP1 and 100 ng of LmPABP2 and -3. (Middle) Eight nanograms of LmPABP2 and 100 ng of LmPABP1 and -3. (Right) Eight nanograms of LmPABP3 and 100 ng of LmPABP1 and -2. (C) Quantitation of the expression levels of LmPABP1, -2, and -3 in extracts of exponentially grown L. major promastigotes. The different recombinant GST fusions, diluted to appropriate concentrations (in fentomoles), and different dilutions of whole parasite extracts were blotted with the corresponding antisera. The results were quantitated by densitometry, and the values were used to estimate the number of molecules per cell, as described previously (20). The results shown are representative of at least four different experiments using a minimum of three independently grown cell cultures. The larger band observed in the LmPABP3 blot represents a minor cross-reaction to one of the other two PABP homologues, probably LmPABP2.

