Fig. 7.
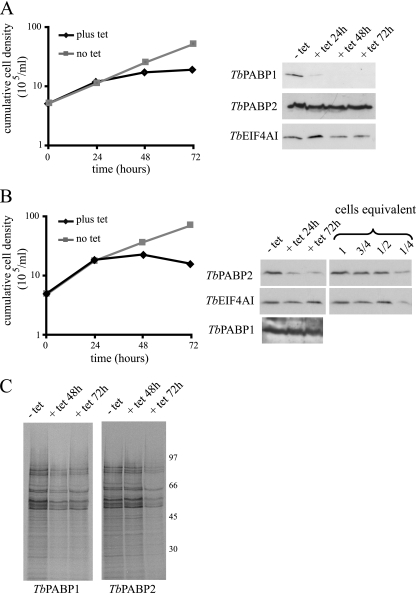
RNA interference of the T. brucei PABP homologues. (A and B) Representative growth curves after tetracycline (tet) induction of the RNAi for TbPABP1 (A) and TbPABP2 (B). Growth was monitored by counting the viable cells, and the expression of TbPABP1 and -2 or an endogenous control protein (TbEIF4AI) was assayed to monitor the efficiency of the RNAi procedure (shown on the right). Note the various dilutions of total cell extract used to estimate the efficiency of RNAi depletion for TbPABP2 (1 to 1/4 cell equivalent; 1 cell equivalent was equal to 106 cells and was used in the various RNAi lanes). The same RNAi samples were blotted on a second membrane, loaded with twice as much cellular extract, to detect TbPABP1. (C) Total protein synthesis at selected time points after tetracycline addition. Metabolic labeling was performed by incubating aliquots of the cells in the presence of [35S]methionine, followed by SDS-PAGE and autoradiography. The sizes of molecular mass markers (in kDa) run on the same gel from the autoradiography are shown on the right. The RNAi results are representative of multiple experiments performed with two distinct transfected cell lines, each submitted to at least one independent labeling experiment.

