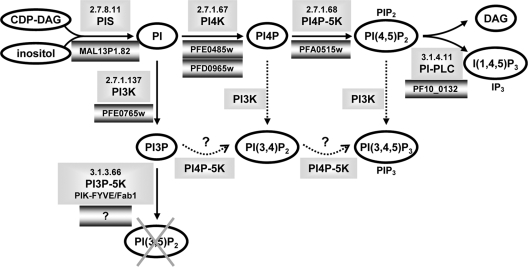
Fig. 7.
Schematic representation of the phosphoinositide metabolism in Plasmodium. Phosphoinositides and metabolites are represented by ovals. The corresponding enzymes together with their EC nomenclature are shown in unbordered shaded boxes, and the predicted or confirmed P. falciparum genes are shown in shaded boxes with dark borders. The putative synthesis of PI(3,4)P2 and PI(3,4,5)P3 through PI3-kinase or PI4P-5-kinase is indicated by dotted arrows. DAG, diacylglycerol; I(1,4,5)P3 (IP3), inositol trisphosphate; PIS, PI-synthase; PI-PLC, PI-specific phospholipase C.

