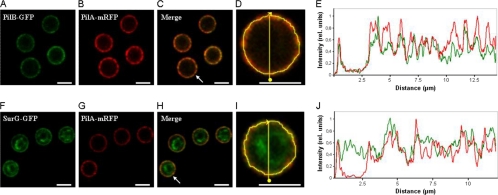
Fig. 6.
Colocalization of PilB with PilA and SurG with PilA in resting conidiospores. Representative confocal fluorescence micrographs (A to C and F to H) and fluorescence intensity profiles of PilA (red curves in panels E and J), PilB (green curve in panel E), and SurG (green curve in panel J) are shown. The fluorescence intensity, plotted along the yellow line in panel D (a magnification of panel C) and panel I (a magnification of panel H) that runs through both the inside and the periphery of the arrowed cell in panels C and H, respectively, was calculated using ImageJ software and normalized to the maximum value. Bars, 5 μm.

