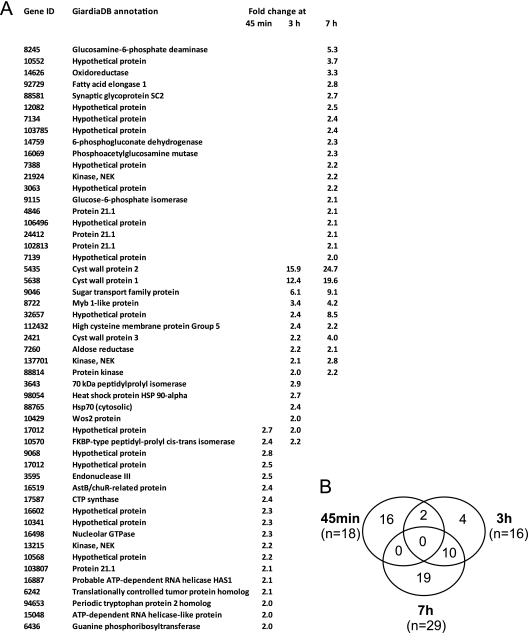
Fig. 1.
Whole-genome microarray analysis of encystation induced by protocol A. (A) List of statistically significantly upregulated genes (cutoff, >2-fold signal increase) at 45 min, 3 h, and 7 h postinduction. (B) Graphical representation (Venn diagram) of overlaps in the three data sets. Note that no gene is present in all three data sets.

