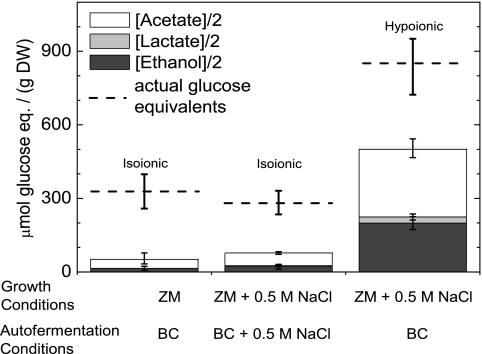
FIG. 6.
Effect of hypoionic conditions on carbohydrate catabolism of A. maxima filaments under autofermentative conditions for 1 day. Cells were grown in Zarrouk's medium (ZM) either with or without additional 0.5 M NaCl. Subsequently, cells were harvested and suspended in bicarbonate buffer (BC) with or without 0.5 M NaCl. Stacked columns show the amounts of excreted products after 1 day of autofermentation divided by 2 to represent how many glucose equivalents (eq.) were catabolized to produce these products via glycolysis. Each column represents the minimal amount of glucose equivalents that must have fermented to yield such values. The actual total carbohydrate content consumed (based on the measured carbohydrate content of filaments before and after 1 day of autofermentation) is displayed as a dashed line. Assuming solely a glycolysis model, if every mole of glucose consumed led to an excreted product, the sum of the stacked values and dashed line value would be equal. Assuming solely an oxidative pentose phosphate (OPP) model, if every mole of glucose consumed led to an excreted product, the sum of the stacked values would equal exactly half of the value of the dashed line. Data display the means ± 1 standard deviation from three measurements.

