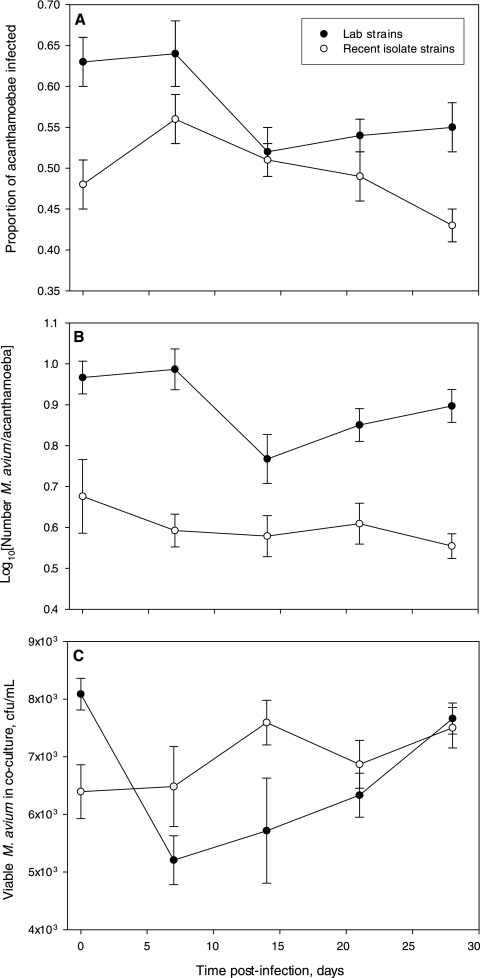
FIG. 1.
Infection dynamics of Mycobacterium avium with laboratory strains (black circles) and recent environmental isolates (white circles) of Acanthamoeba. (A) Proportion of Acanthamoeba strains infected after initial infection; (B) average number of M. avium cells per infected Acanthamoeba cell over time; (C) viability of M. avium in coculture with Acanthamoeba strains over time. Data points are mean average values for four strains of Acanthamoeba (either recent environmental isolates or laboratory strains), and each strain was tested in triplicate. Viability was assessed as the number of CFU per ml of culture medium in coculture, and samples at each time point were plated in duplicate. ANOVA indicated that the variables of time and strain type were significant explanatory factors for all response variables presented (P < 0.05). Error bars indicate 95% confidence intervals.

