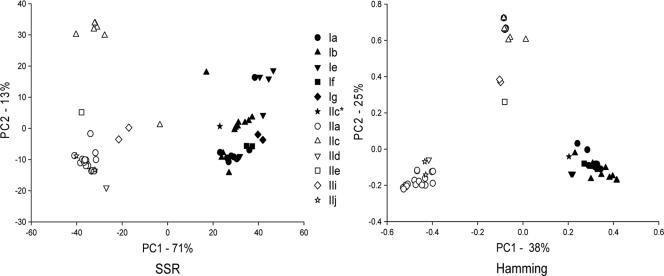
FIG. 1.
PCoA of 60 unique C. parvum and C. hominis MLGs. GP60 alleles are colored according to species: white, C. parvum; black, C. hominis. Symbols represent alleles as indicated in the embedded legend. The C. hominis MLG with a IIc allele is shown with a black star and an asterisk in the legend. PCoA is based on SSR genetic distance (left) and Hamming distance (right). The percentages variation explained by the 1st and 2nd axes are indicated.

