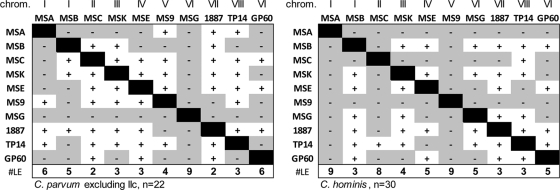
FIG. 4.
Pairwise linkage analysis. Pairs of markers in LD are represented with white squares and +. Linkage equilibrium is indicated with a shaded field and −. Column totals in the bottom row show for each marker the number of markers in linkage equilibrium. The chromosome location of each marker is shown at the top. Two pairs of markers are located on chromosome I and VI. The distance between MSA and MSB is more than 400,000 bp and between MSG and GP60 is over 140,000 bp. Left, C. parvum excluding IIc MLGs (n = 22); right, C. hominis (n = 30).

