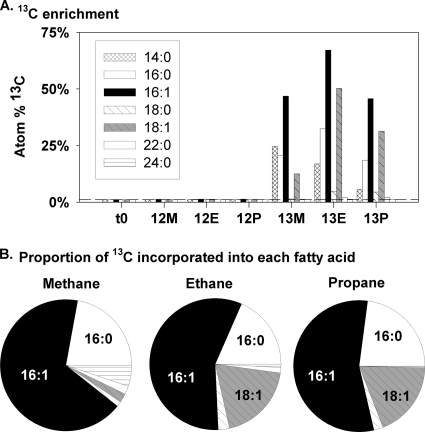
FIG. 1.
(A) 13C enrichment of phospholipid fatty acids of 13C methane (M), ethane (E), and propane (P) incubations and 12C controls in initial sediment (t0) and at final time points. The 16:1 and 18:1 isomers were not differentiated. The dashed line indicates natural abundance levels of 13C. (B) Proportion of 13C incorporated into each fatty acid.

