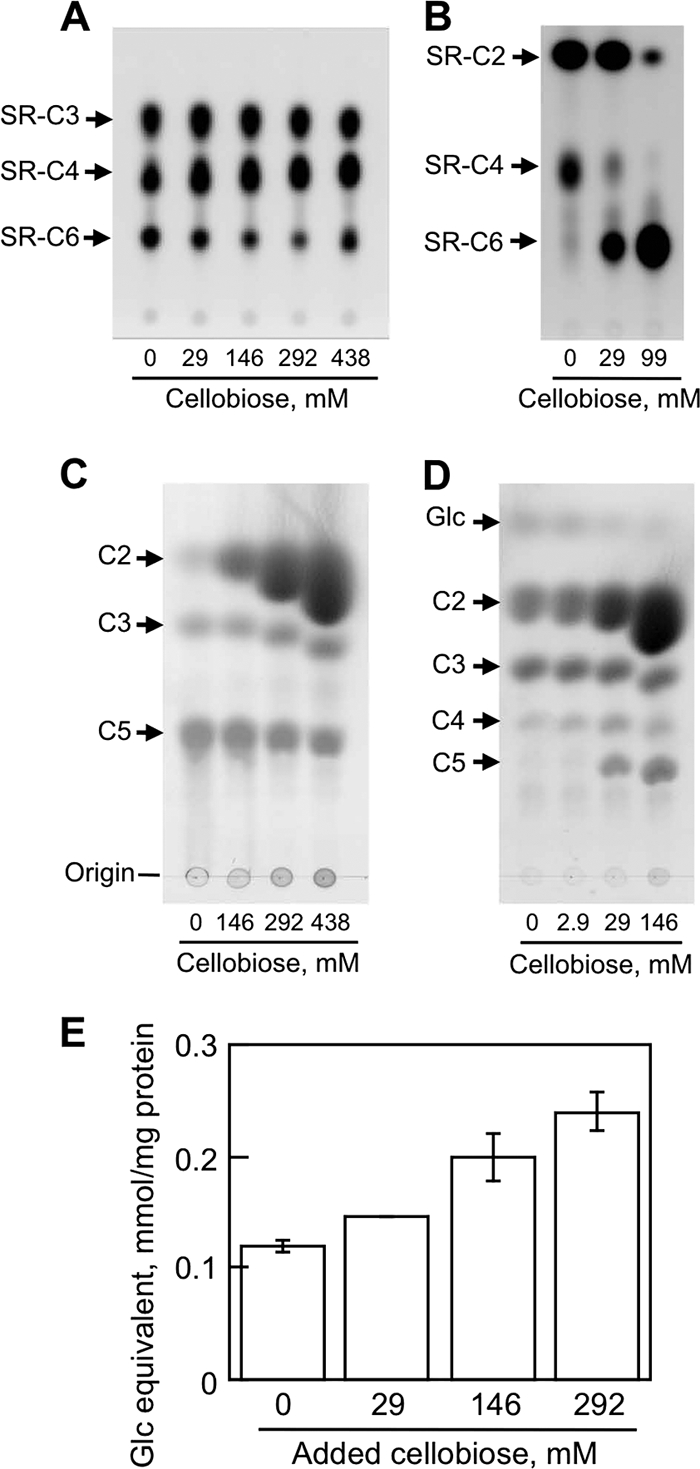
FIG. 4.

Effects of excess cellobiose on hydrolysis of cellooligosaccharide derivatives. (A) MoCel6A hydrolysates of SR-C6 in the presence of 0 to 438 mM cellobiose were separated by TLC using butanol-acetic acid-water (2:1:1), and fluorescent spots were visualized under UV light (254 nm). (B) Hydrolysis of sulforhodamine-conjugated cellohexaose by MoCel7A in the presence of 0 to 146 mM cellobiose; fluorescent products were observed as described for panel A. (C) MoCel6A hydrolysates of C5 in the presence of 0 to 438 mM cellobiose were separated by TLC in butanol-acetic acid-water (2:1:1) and stained with 0.1% thymol in H2SO4-ethanol (EtOH) (5:95 [vol/vol]). (D) Hydrolysis products of cellopentaose by MoCel7A in the presence of 0 to 146 mM cellobiose were analyzed as described for panel C. (E) Quantification of cellotriose released from cellopentaose by MoCel6A was measured by calculating the cellotriose peak area analyzed by LC/MS. Cellobiose was added to the reaction mixtures at final concentrations of 29 to 292 mM. The data are the means of three determinations ± SE.
