FIG. 3.
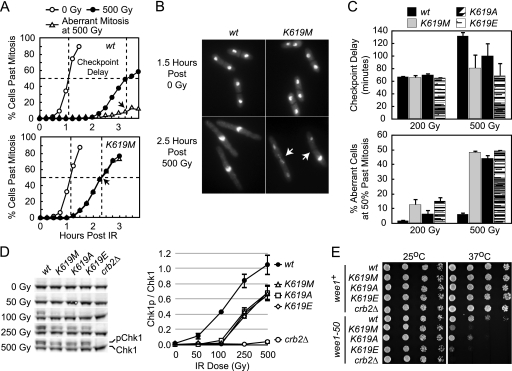
The pH2AX-binding activity of Crb2 is required for a fully functional G2/M DNA damage checkpoint. (A) DNA damage checkpoint assay. Strains were grown in rich media at 30°C and G2 synchronized by lactose gradient sedimentation. G2 cells were then either untreated (0 Gy) or IR exposed (500 Gy) and allowed to recover at 30°C in liquid media. Cell aliquots were taken every 15 min (time indicated on x axis) and methanol fixed, and mitotic progression was assessed by DAPI staining (y axis). Shown are representative data from a single experiment with WT and crb2K619M cells in which 200 to 300 cells were counted for each point. (B) Representative images of DAPI-stained WT and crb2K619M cells after exposure to either 0 or 500 Gy of IR (time indicated at left). Arrowheads denote the septa of two crb2K619M cells that have undergone aberrant mitosis as indicated by unequal segregation of nuclei (right cell) or nuclear fragmentation (left cell). (C) Quantification of checkpoint delay (top) and aberrant mitosis (bottom) in crb2K619 mutants. Checkpoint delay was determined by measuring the difference in time required for 50% of the cells to pass mitosis with or without irradiation (see dashed lines in panel A). Aberrant mitosis was calculated by plotting the percentage of aberrant cells after IR exposure and then determining the intercept at the time point for which 50% of cells had passed mitosis (see arrowheads in panel A). Data are averaged from results of three independent experiments in which all four strains were processed at 0 and 200 Gy or 0 and 500 Gy simultaneously. (D) Lys619 of Crb2 is required for optimal IR-induced Chk1 phosphorylation. Strains harboring chk1-HA3 and the labeled crb2 mutations (top) were treated with the indicated dose of IR (left) and immediately processed for quantitative Western blotting using anti-HA and a fluorescent secondary antibody (see Materials and Methods). After fluorescent imaging, the ratio of phosphorylated (p) versus unphosphorylated Chk1 was determined. The left shows a representative image from a single experiment, and data from two independent experiments are averaged and plotted with standard deviation on the right. (E) Synthetic sick interaction between the crb2K619 and wee1-50 mutations. Serial dilutions of strains with the left-labeled mutations were spotted onto rich media and grown at the indicated temperature.

