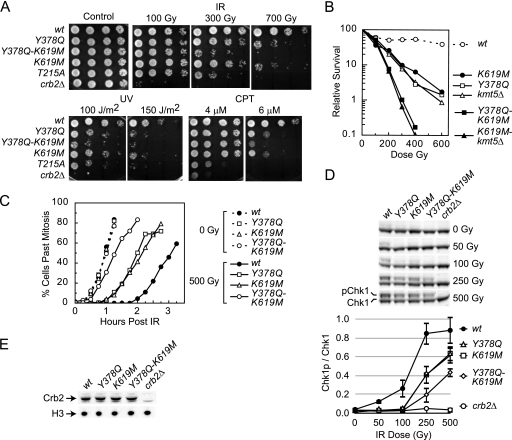
FIG. 4.
A combined loss of H4K20me2 and pH2AX-binding activity impairs Crb2 function additively. (A and B) Phenotyping and IR survival curves were performed as described for Fig. 2B and C. IR data are averaged from results of three independent experiments with a standard error of 10% or less. (C and D) G2/M DNA damage checkpoint activity and Chk1 phosphorylation were monitored as detailed in Fig. 3A and D. The top of panel D shows a representative image from a single experiment, and data from two independent experiments are averaged and plotted with standard deviation on the bottom. (E) Crb2 protein levels in mutant strains. Strains with the top-labeled mutations were processed for Western blotting as described for Fig. 2D.

