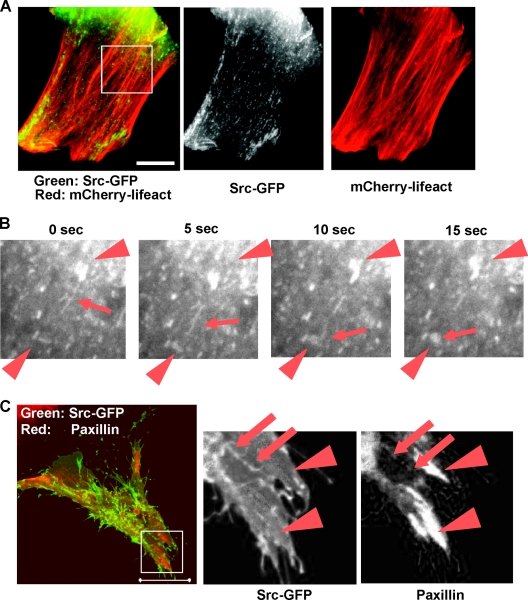
FIG. 3.
Time-lapse video microscopy of Src-GFP in XTC cells transfected with mDia1ΔN3. (A) Coimaging of mCherry-lifeact and Src-GFP. XTC cells expressing mDia1ΔN3 were identified as cells showing parallel actin fibers, and Src-GFP and mCherry-lifeact signals were monitored. A still image is shown. Bar, 5 μm. (B) Tube extension and fusion of Src-GFP signals. Src signals boxed in panel A were video monitored at 400 ms per frame at the interval of 5 s. Arrows show Src-GFP moving along actin stress fibers. Arrowheads show Src in vesicular structures. (C) Colocalization of Src-GFP and signals for paxillin. XTC cells expressing Src-GFP and mDia1ΔN3 were fixed and stained for paxillin (red). Arrowheads indicate matured focal adhesions, and arrows indicate colocalization of paxillin and Src. Bar, 20 μm.

