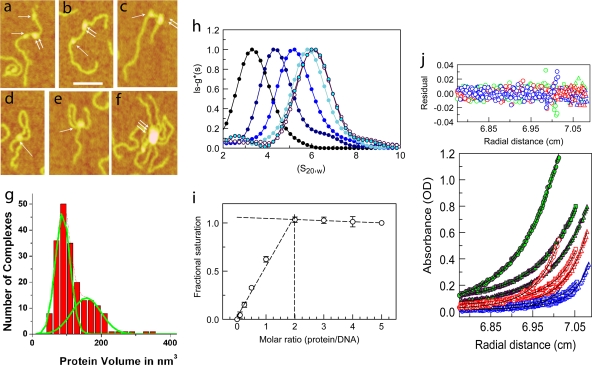
FIG. 1.
DNA-MeCP2 interactions. (a to f) AFM images of MeCP2-DNA complexes. (a to c) DNA strands with circular (single arrows) and elliptical (double arrows) MeCP2 foci. (d and e) DNA loops with circular MeCP2 foci at the base. (f) Large complex containing multiple DNA strands and MeCP2 molecules. Scale bar = 50 nm. (g) Histogram of the calculated volumes of individual MeCP2 foci indicating two Gaussian distributions, with mean volumes of 88 nm3 and 157 nm3, close to those expected for the MeCP2 monomer and dimer, respectively. The elliptical foci center on the higher value. (h) Normalized lsg*(s)-versus-S20,w plot showing sedimentation coefficient distributions of 45 bp of DNA and complexes comprising 45 bp of DNA and MeCP2 at increasing (0-, 1-, 2-, 3-, 4-, and 5-fold) molar inputs of MeCP2. The fold input of MeCP2 increases from left to right. Saturation is reached at a 4-fold input. A small peak at 2.5 S represents free MeCP2 at the 5-fold protein input. (i) Normalized plot of change in fluorescence anisotropy of a fluorescein-labeled, unmethylated 23-bp DNA at various MeCP2/DNA ratios. Saturation is reached at a 2-fold input of MeCP2. Error bars represent standard errors of the means (SEM). (j) Multiwavelength, multispeed sedimentation equilibrium profile of the unmethylated 11-bp DNA substrate incubated with MeCP2 (3 μM DNA-3 μM protein) in 200 mM NaCl. Data were collected at 230 nm (circles), 260 nm (squares), and 280 nm (triangles) and speeds of 15,000 (green), 20,000 (red), and 25,000 (blue) rpm. Solid lines represent global fits obtained using the A+B heteroassociation model, where A represents DNA and B represents protein. The residuals of the fits are shown in the top panel.

