FIG. 8.
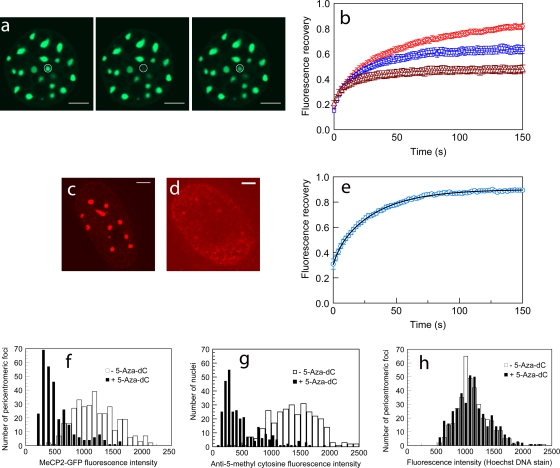
FRAP kinetics of MeCP2-GFP in pericentromeric heterochromatin is regulated by H1 concentration and the methylation status of chromatin. (a and b) Microinjection of H10 accelerates MeCP2-GFP FRAP in HC. (a) FRAP at a 1-μm-radius heterochromatic spot in a cell expressing GFP-tagged MeCP2. From left to right are prebleaching, bleaching, and postbleaching images. (b) FRAP profiles of GFP-tagged MeCP2 in HC in control cells (red) and cells injected with 250 μM (blue), and 500 μM (brown) H10. Error bars represent SEM. The FRAP profiles show the mean values for 20 or more different nuclei. Scale bar = 5 μm. (c to h) Treatment with 5-Aza-dC reduces DNA methylation and MeCP2 binding in PHC. (c and d) Immunodetection of methyl cytosine in MeCP2-GFP-expressing cells reveals that upon 5-Aza-dC treatment there is a marked loss of methylation in PHC (d) compared to the level for untreated cells (c). Scale bar = 5 μm. (e) Fluorescence recovery profile of MeCP2 in HC of nuclei treated with 5-Aza-dC. FRAP profiles show the mean values for 20 or more different nuclei. FRAP was performed in nuclei in which the fluorescence intensities in HC were at least half of the values for untreated nuclei. The effect of demethylation on MeCP2 binding kinetics is therefore underestimated. Error bars represent SEM. (f) MeCP2-GFP fluorescence intensity in PHC of cells treated with 5-Aza-dC (n = 300) or dimethyl sulfoxide (DMSO) only (n = 351). Nuclei in which GFP fluorescence of PHC foci was absent are not included. (g) Distribution of anti-5-methyl cytosine antibody in nuclei of cells treated with 5-Aza-dC (n = 300) or DMSO only (n = 300). (h) The Hoechst fluorescence intensity in PHC foci of cells treated with 5-Aza-dC (n = 400) is similar to the level for the DMSO-only control (n = 351).

