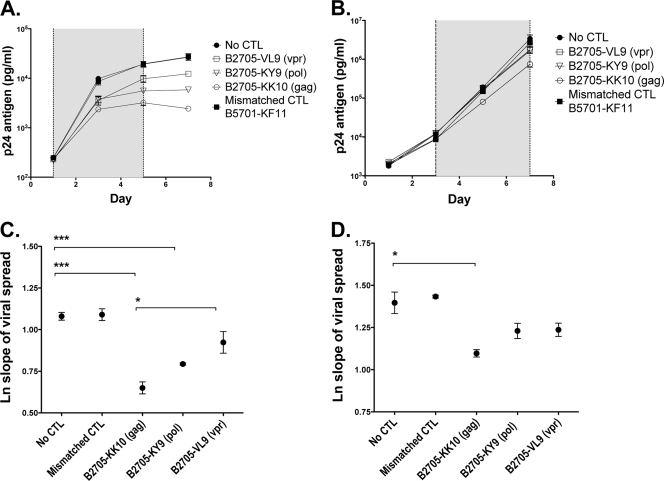
FIG. 5.
Gag-, Pol-, and Vpr-specific CD8+ T cells were tested for their effects on viral spread in a 7-day viral inhibition assay. (A and B) U937 cells were infected at an MOI of 0.02 with HIV-1 NL4-3 and cocultured with tetramer-enriched CD8+ T cells at an effector-to-target (E/T) ratio of 1:100 (A and C) and 1:1,000 (B and D). The supernatant was harvested every 2 to 3 days, and the p24 level was quantified by ELISA. Vpr VL9-specific CD8+ T cells from subject R035, Pol KY9-specific CD8+ T cells from subject R039, Gag KK10-specific CD8+ T cells from subject R039, and the HLA-mismatched Gag KF11-specific CD8+ T cells from subject R039 were tested. Each was run in triplicate. The shaded area shows data points taken from within the exponential growth phase used to calculate the slope of viral spread. Error bars show SEM. (C and D) The natural log slope of viral spread was calculated for each cell line as described in Materials and Methods. The mean values ± SEM are shown. Results were compared by using ANOVA and Bonferroni's multiple-comparison test. *, P < 0.01; **, P < 0.001; ***, P < 0.0001. Mean viral spread ± SEM and P values are shown in Table 1.

