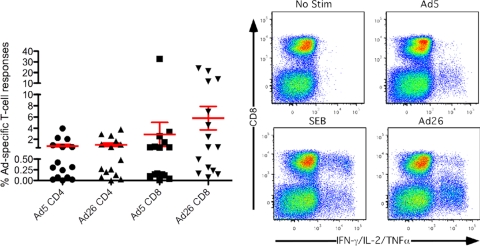
FIG. 4.
Human T-cell responses to AdHu5 and AdHu26. T-cell responses to AdHu5 and AdHu26 were measured by flow cytometry following whole-vector stimulation. (Left panel) Magnitudes of the CD4+ or CD8+ T-cell responses producing IL-2, IFN-γ, and/or TNF-α to AdHu5 and AdHu26 in 15 healthy subjects. Lines represent the average ± SEM. (Right panel) Representative flow plots of the T-cell response to no stimulation (top left) and staphylococcus endotoxin B (SEB) (bottom left) controls as well as AdHu5 (top right) and AdHu26 (bottom right).

