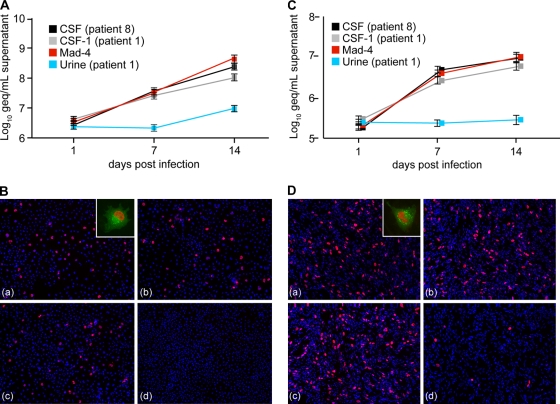
FIG. 3.
Replication of rr-NCCR JCV in cell culture. (A) Time course for prototypes CSF (patient 8), CSF-1 (patient 1), Mad-4, and archetype urine (patient 1) in Hs683 cells. DNase-protected JCV DNA was quantified by qPCR from cell supernatants collected at the indicated times after transfection. The data display the means from two independent experiments determined in triplicate. Error bars indicate the means ± standard deviations. (B) Immunofluorescence of JCV prototypes CSF (patient 8) (a), CSF-1 (patient 1) (b), Mad-4 (c), and urine (patient 1) (d) was performed at 7 dpt in Hs683 cells. Large T antigen (red) and agnoprotein (green) were detected using monoclonal mouse anti-large T antigen visualized with anti-mouse Cy3 and polyclonal rabbit anti-agno stained by anti-rabbit Cy2, respectively. Cell nuclei were visualized by Hoechst 33342 dye (blue). (C) Time course for prototypes in PDA cells as described for panel A. DNase-protected JCV DNA was quantified by qPCR from cell supernatants collected at the indicated times after infection. The data display the means from two independent experiments determined in triplicate. Error bars indicate the means ± standard deviations. (D) Immunofluorescence for prototypes was performed at 14 dpi in PDA cells as described for panel B.

